SACH: System Adequacy of the Swiss Electricity Supply
Development of an overall concept for the system adequacy security assessment with following indicators
- Energy not Served (GWh/a) - ENS
- Loss of Load (h) - LOL
- Reserve Capacity Margin (GW) - RCM
Considering recent trends and expected developments in the electricity sector in Switzerland and Europe covering a 20-year horizon, from 2020 to 2040.
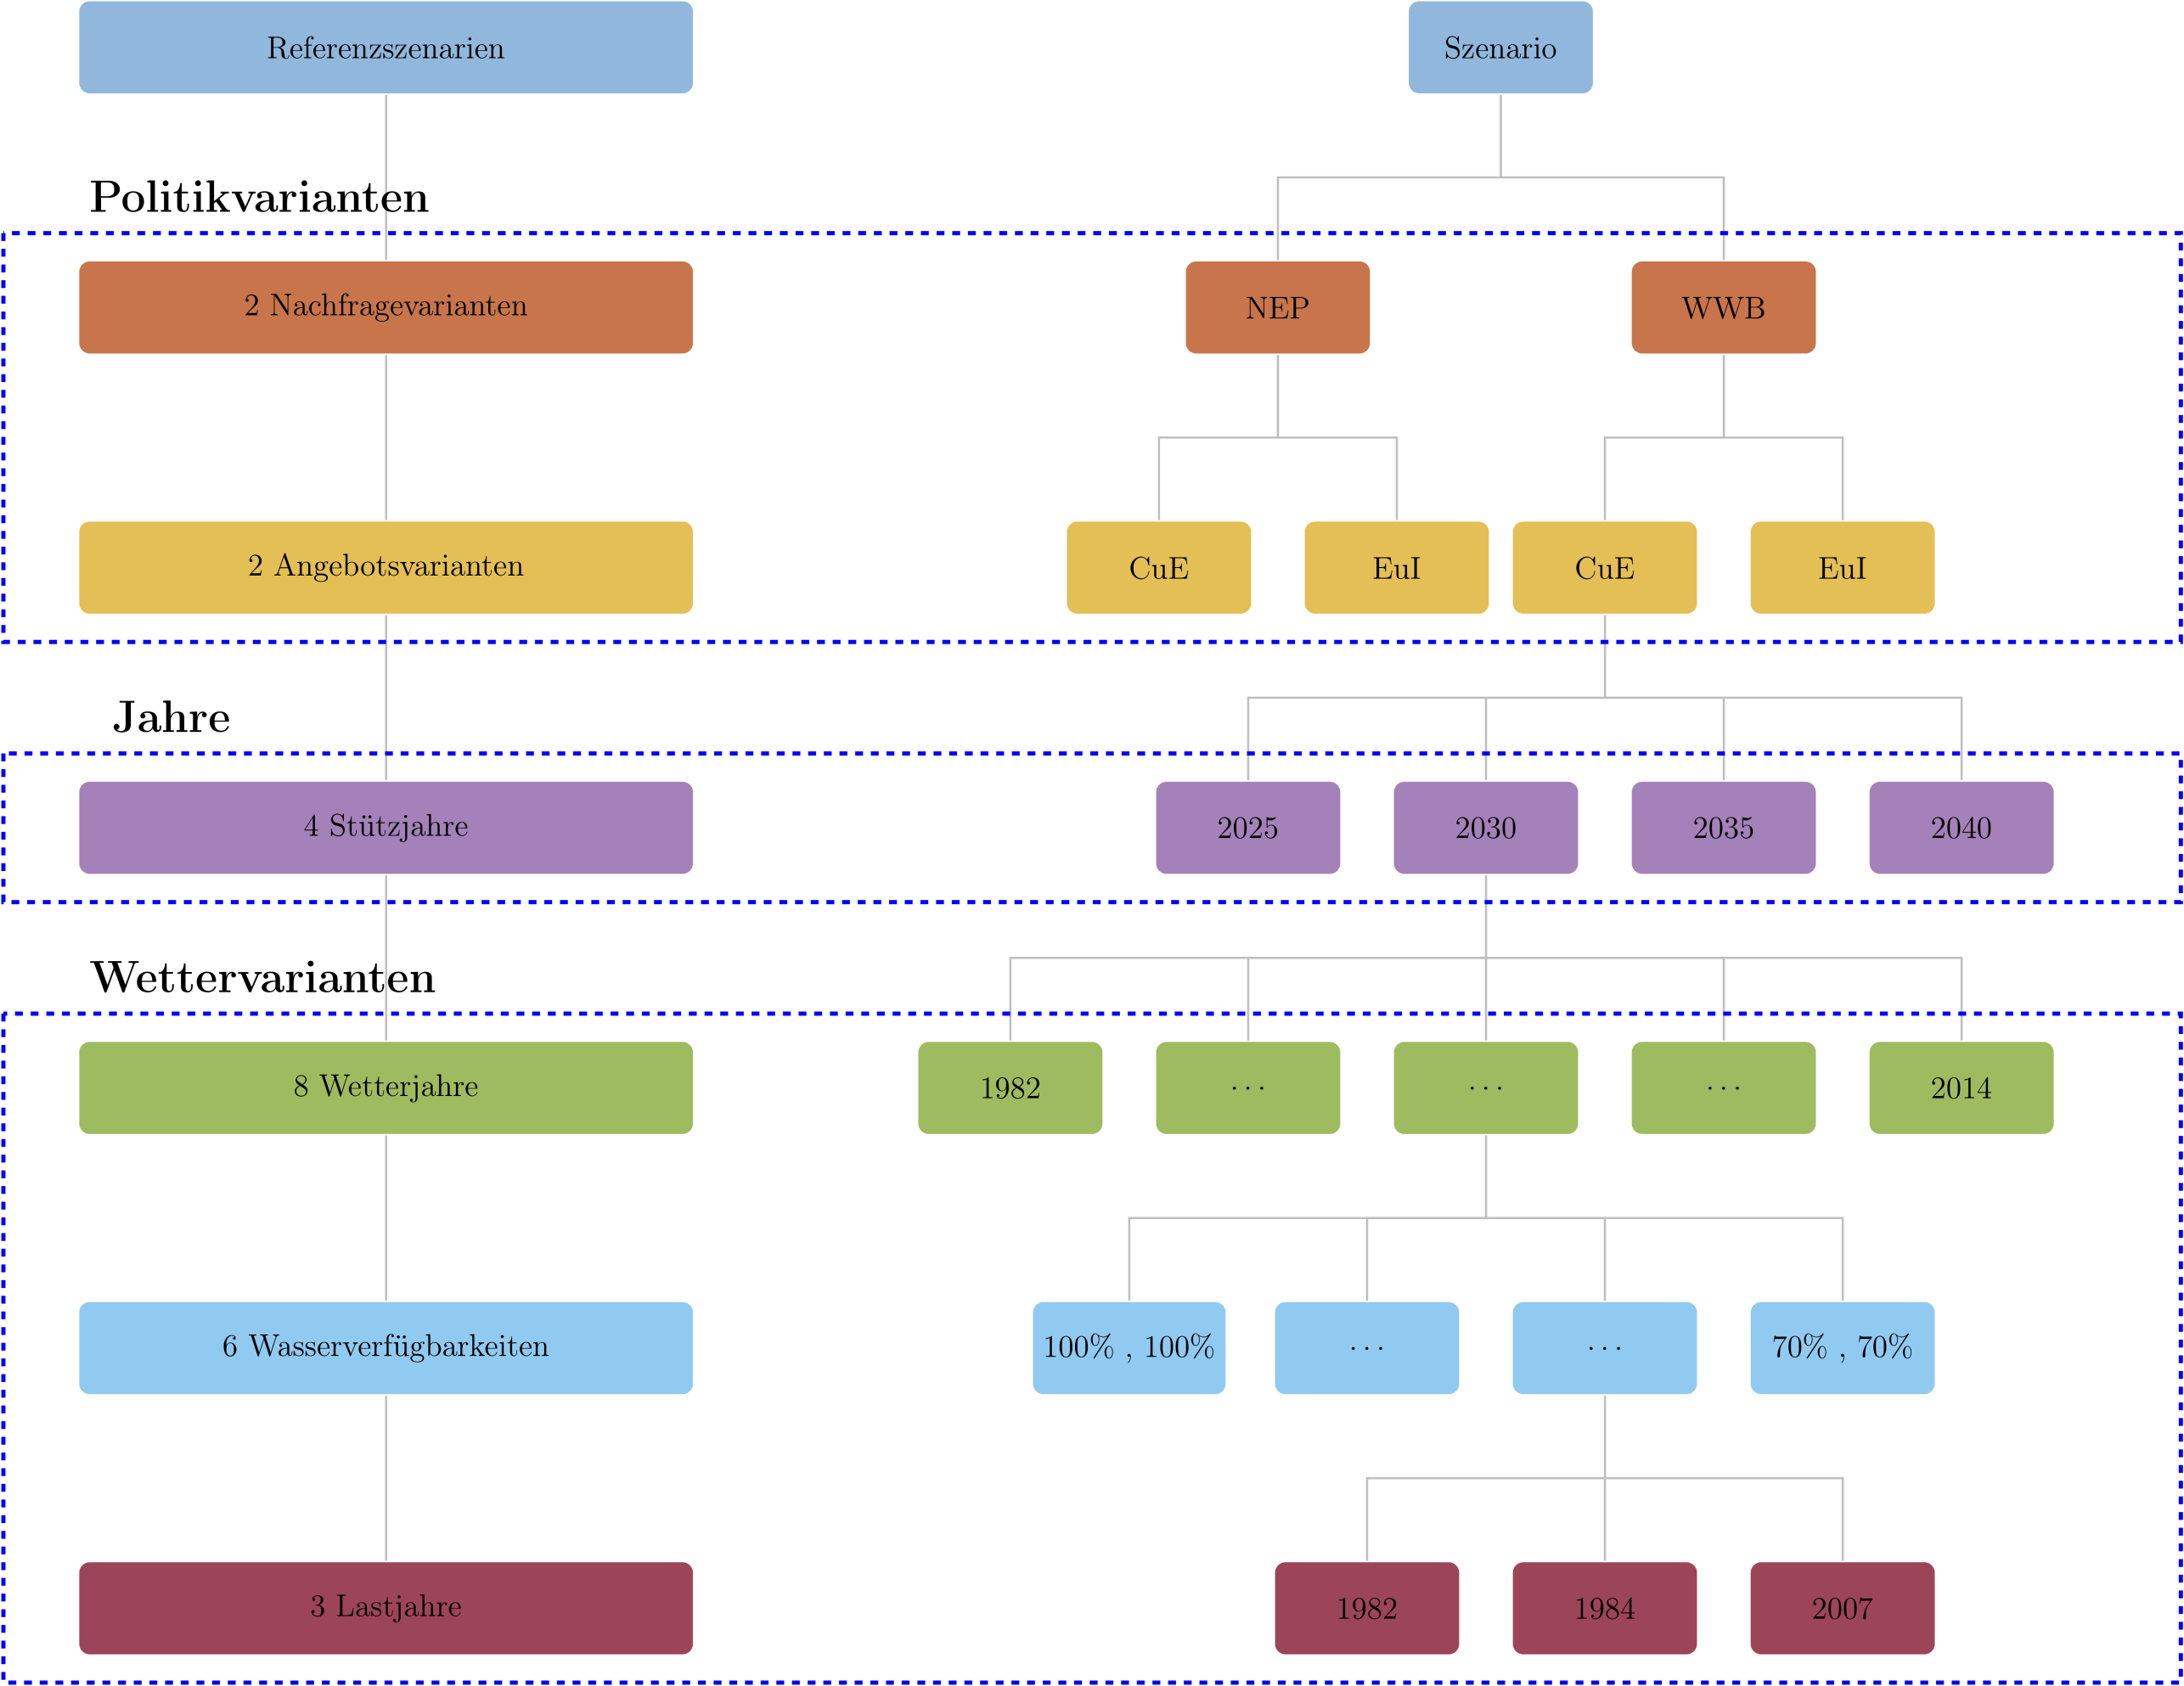
Variations in supply: assessing their impact on security of supply
- Accelerated increase in renewable energies in Switzerland ... (r)
- Early decommissioning of Nuclear Power Plants (NPP) in France ... (f)
- Coal phase-out in Germany ... (d)
- Combination of the NPP and Coal phase-out ... (fd)
Variations in demand:
- Increased electrification (accounting for electrification of heating and mobility) with an annual demand growth rate of 1.25% is assumed from 2025 on ... (s)
Network related sensitivities:
- 10-year delay in Network expansion measures ... (g)
- Net import restrictions ... (n)
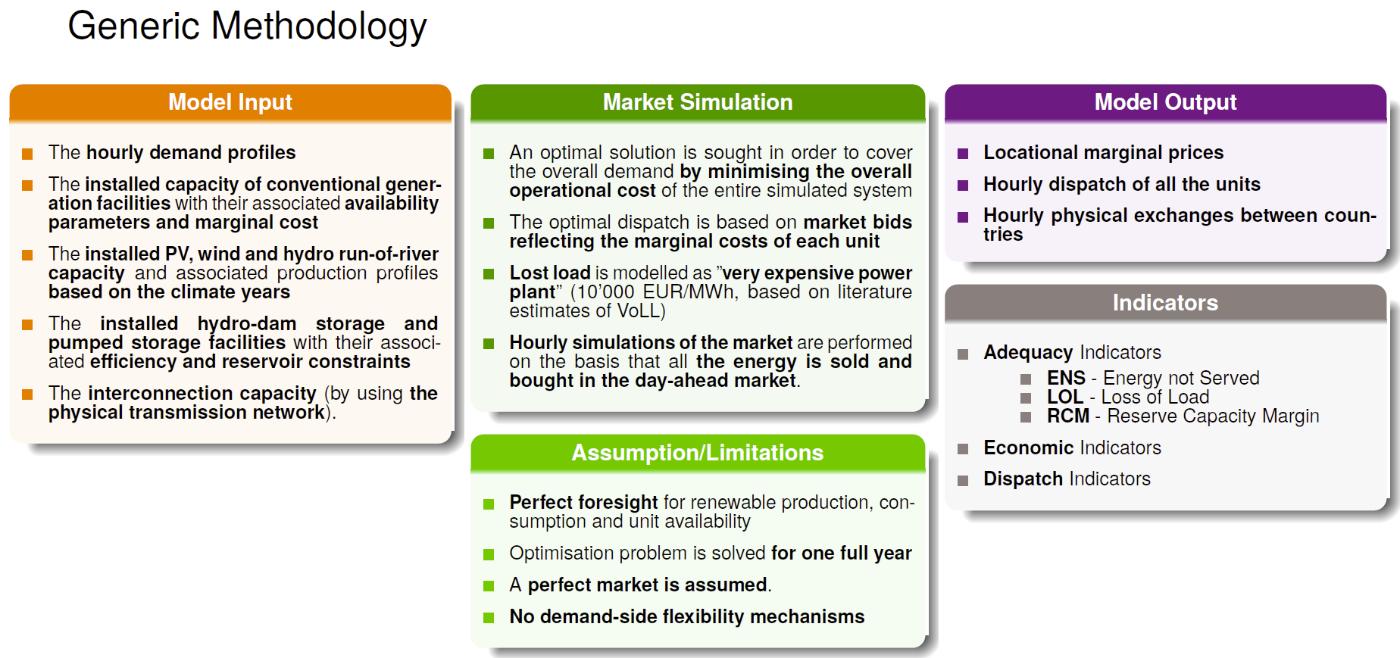
Methodology
The Swiss and European electricity systems are profoundly and rapidly reshaping whilst safeguarding the security of supply:
- Supply-side: increasing decentralisation, integrating high volumes of variable renewables, phasing out of some conventional fuel-based generation sources
- Demand-side: electrification of mobility and heating
What are the consequences for security of supply?
FlexECO
- The tool performs yearly optimal dispatch, and, accordingly, assesses the generation and transmission adequacy, with DC representation of the electricity network
- Optimization in hourly resolution for 8760 hours
- No investment decision is made. The tool is being extended to include investment decision variables
- Generation technologies: European-level existing fleet and the renewable generation potentials including wind and solar
- Storage technologies: European-level existing fleet such as pumped-hydro as well as reservoir hydro
- Nodal representation. Each node can be modeled as a (i) the corresponding substation, (ii) zones within a country, (iii) country, or (iv) multiple countries. In this study, each node represents multiple zones in every country (e.g., France is represented by 9 zones).
- The tool is based on an optimized C++ code. (Example for the performance: 1-year simulation in hourly resolution may take up to 300 seconds for problems with sizes up to 100 nodes)
- Climate uncertainty, which subsequently influences wind/solar/hydro generation potentials as well as the demand, is addressed through Monte-Carlo simulations. Since statistical distributions of selected parameters are used as input, the result is the statistical distribution of each indicator of interest.
- Input data:
- Hourly time-series of electricity demand
- Electricity generation installed capacities
- Hourly timeseries of wind, solar, run-of-river production
- Reservoir hydro inflows
- Country pumped-hydro storage capacities
- Model of the European electricity network (in DC)