Voltage stability assessment
The findings from the work of FEN should enable the utility to understand whether there is a voltage stability problem in its HV and MV grids and what types of measures it has to take to prevent voltage collapse in its networks on a sound basis. The core questions to be answered:
- What is the highest (total or per bus) demand that will not cause voltage collapse at each bus?
- Is there an order in which the demand shall be taken into service to avoid voltage problems?
The Swiss utility is responsible for ensuring a high-quality electricity supply in its grids at network layer 3 and below. The utility observes multiple key performance metrics such as voltage quality (i.e., whether the voltage magnitude at each bus is within acceptable margins) in order to measure the quality-of-service. One of the contributors to the “voltage quality” is the performance of the system in terms of voltage stability.
In the wake of possible changes in the availability of electricity energy supply in the upcoming winter due to continental concerns, the utility is interested whether there is a voltage stability problem at load buses in its HV and MV networks, when the utility re-energizes the demand either simultaneously or with a pre-defined order following a large-scale load shedding event. The utility is interested to investigate what the voltage stability margin in the system is and how this margin can be measured.
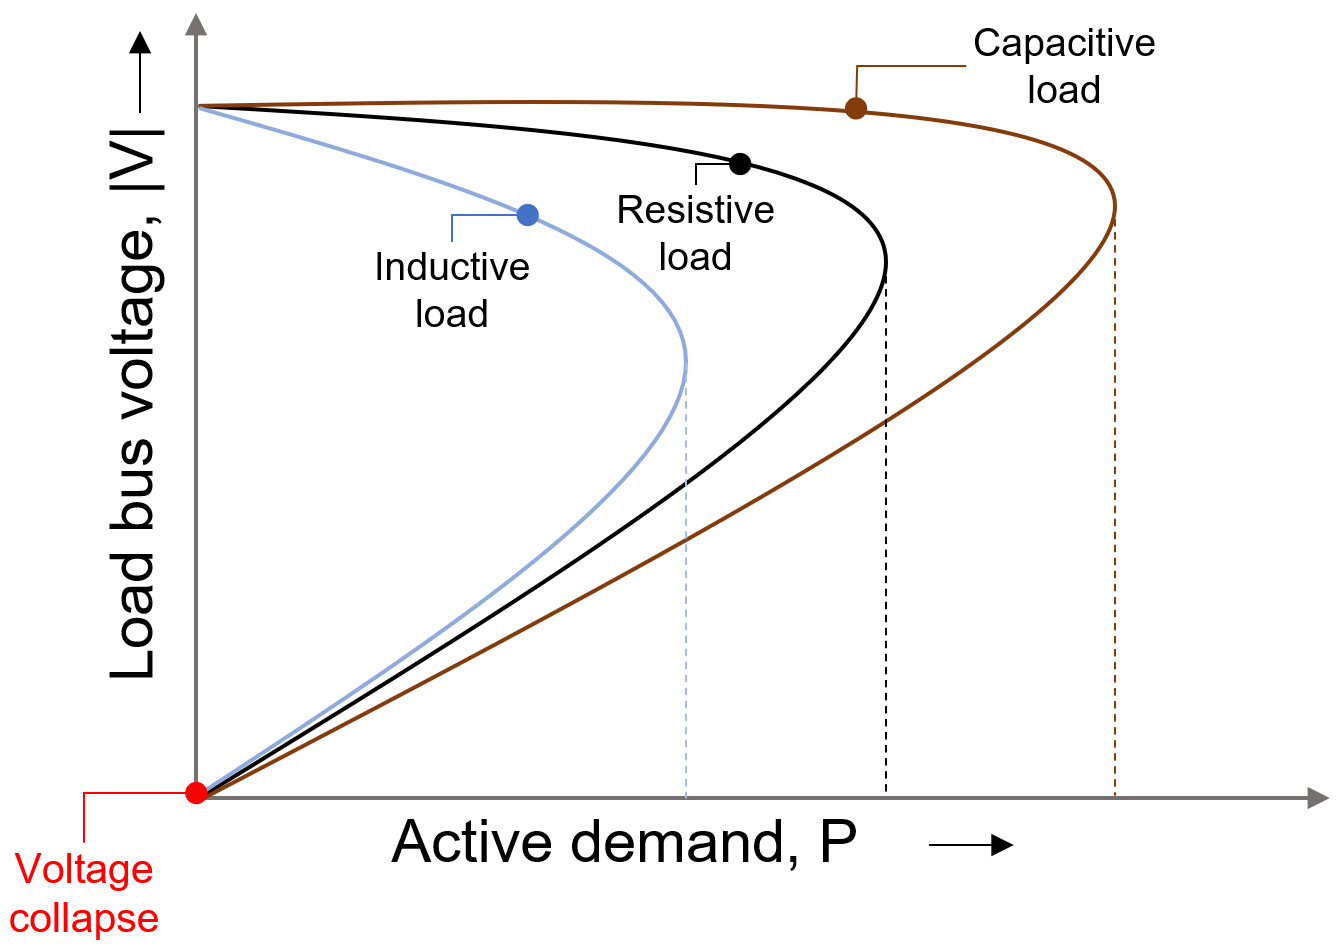
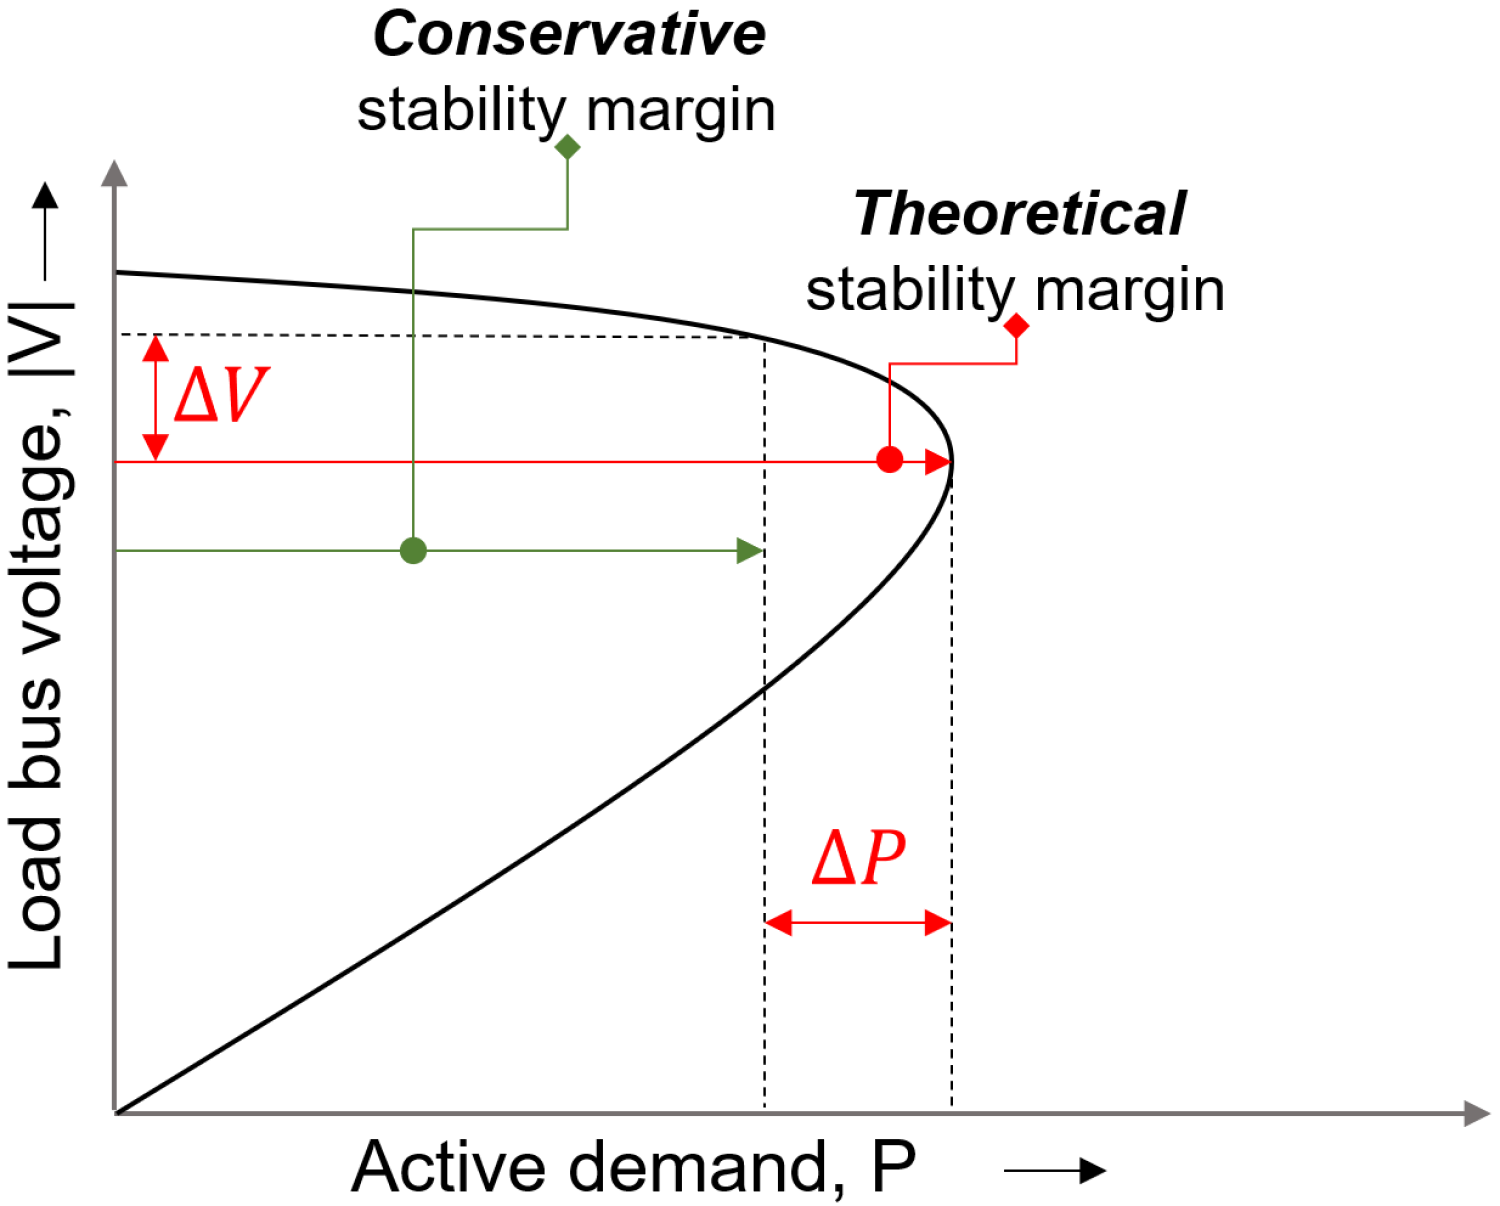
Voltage stability is defined as the ability of a system to maintain the bus voltages at every bus within the limits during normal operation as well as after being subjected to a small- or large-scale disturbance. As demonstrated in Figure 1, the relationship between the magnitude of the load bus, |V|, and the active load, P, is nonlinear and significantly influenced by the type of the load (i.e., resistive, inductive, capacitive). It has been the common practice that the network operators identify a “voltage stability margin” (Figure 2), determined by
- their engineering practice,
- the legacy network infrastructure (e.g., dominated by cables or overhead lines, existence of tap changes, shunt voltage regulators), as well as
- the type of the load (e.g., voltage dependent, constant current, constant impedance, constant power, etc.).
The assessment of the voltage stability in the power networks is performed using well-known tools, however, the type of the assessment is dependent on the interest of the “type of the event”. Within the scope of this study, the focus is on “stationary or static voltage stability”, which is used when the objective is identifying the stability margin for planning purposes.
The focus is on the voltage stability margins at load buses in HV (NE3) and MV grids (NE5). A power-flow-based approach is proposed by FEN to determine the static voltage stability margin at each bus, for identified steady-state operating conditions such as the worst day in winter. The sensitivity of each bus voltage magnitude to demand will be calculated to identify the “weak” and “strong” buses. Successive power flow runs will be performed
- first, by increasing the active and reactive demand (P and Q) while holding the power factor constant (as in the base case) for each bus at a time, to identify the variation in the voltage sensitivity, ∆Vi/∆Pi, where i denotes the bus number, |Vi| is the voltage magnitude at bus i and Pi is the active demand at bus i (this process will be repeated for each bus), and
- then, by increasing the demand in the whole network progressively and observing the ∆Vi/∆Pj, where i ≠ j.