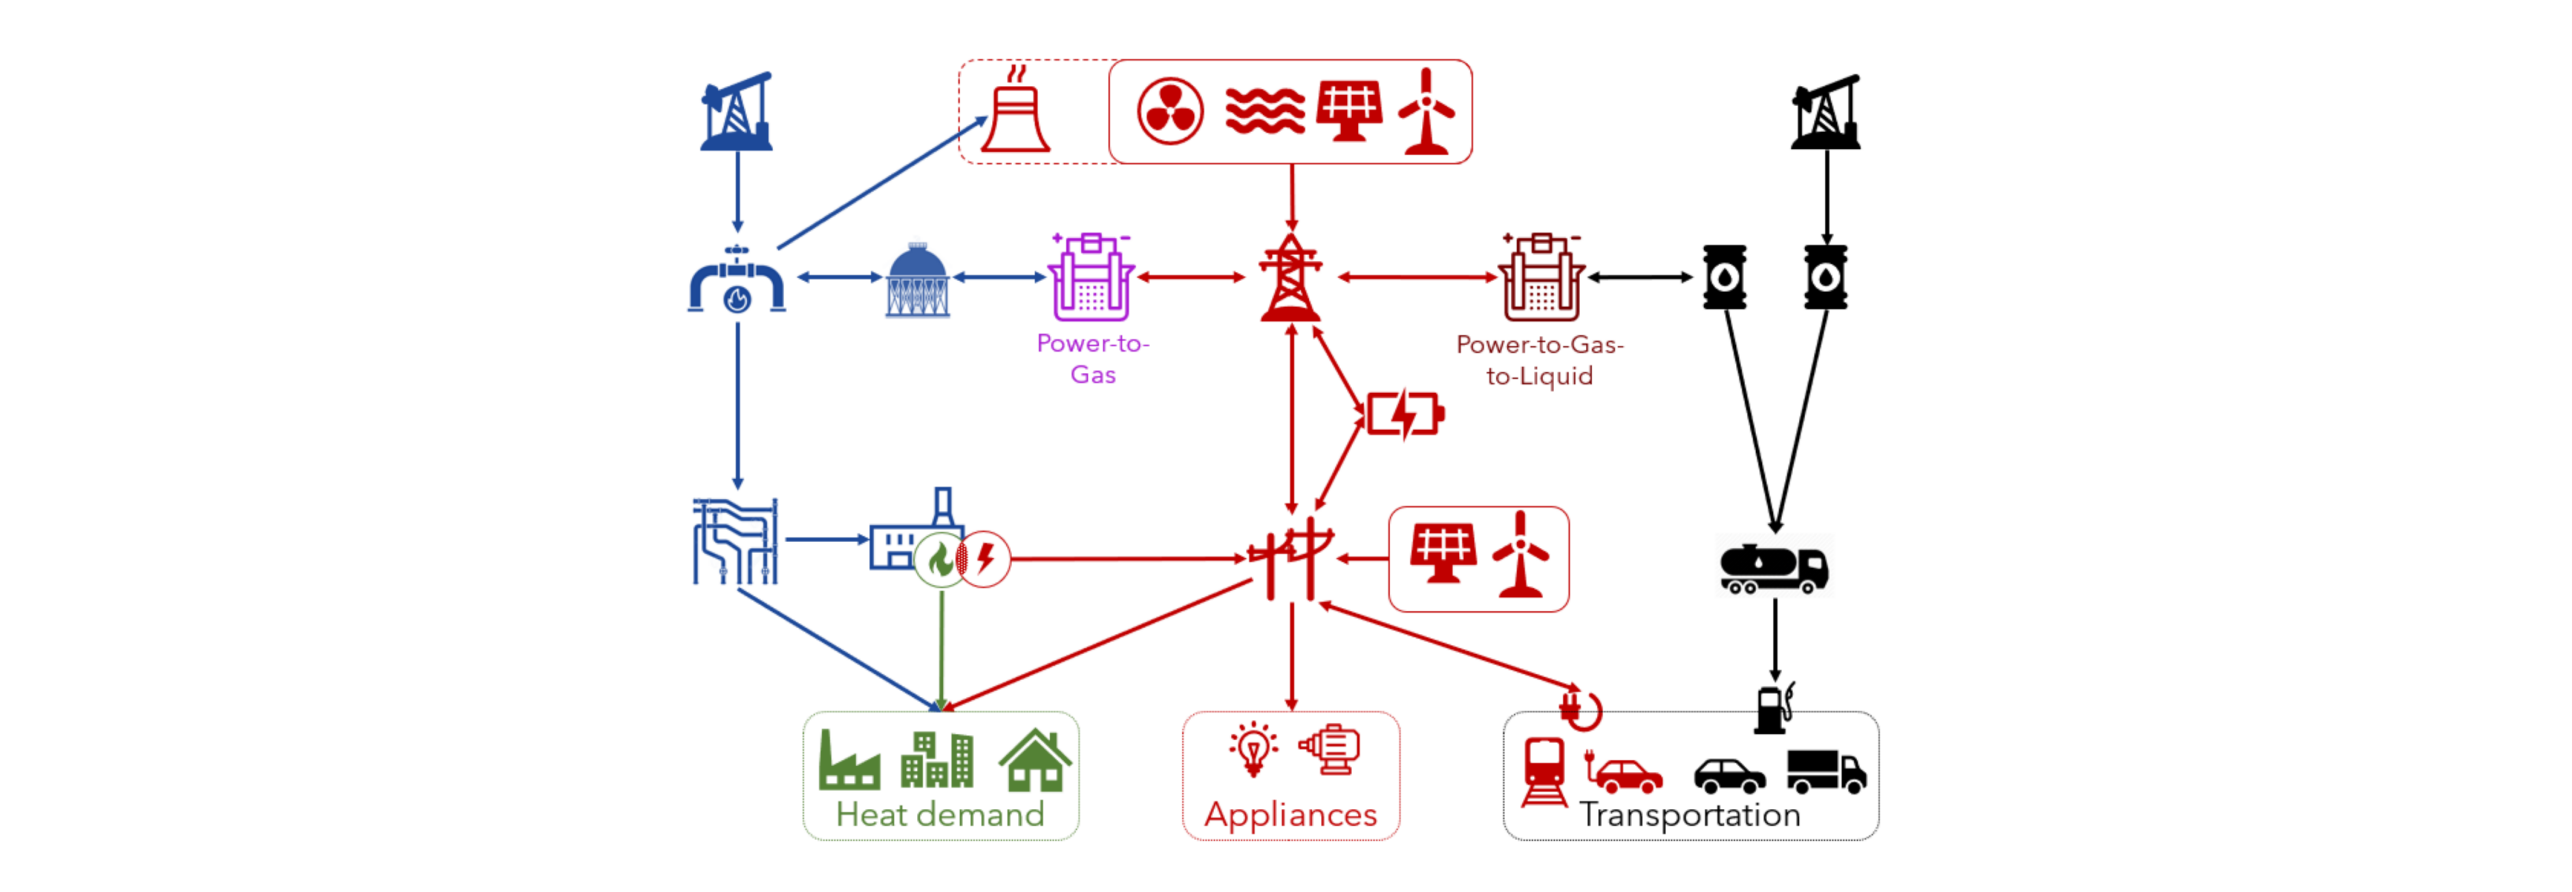
Sector Coupling
Partners: ETHZ (FEN), SGEN, VSG, SVGW, BKW
Duration: 01/2020 - 09/2021
Funding: SGEN
Project Leader: FEN
Project Team: Dr. Adamantios Marinakis, Dr. Turhan Demiray
This project has the following objectives:
- Identify the optimal energy system infrastructure(s) which can accommodate the 2050 target of a Swiss energy system with net-zero CO2 emissions. “Optimality” will be assessed in terms of (i) cost, (ii) CO2 emissions, and (iii) security of supply.
- For each identified final energy system infrastructure, consider and quantify the optimal transition from today’s energy system.
- The potentials and limitations of the various technical solutions should be illustrated.
Within the above-described scope, the project partners have expressed their particular interest in the following questions/topics:
- What is the role of renewable gases in the future energy system of CH?
- The emphasis should be on the sector coupling aspects: mainly (i) coordinated planning of electricity and gas infrastructure, and (ii) service provision to electricity sector from other sectors.
- Is a separate network needed to transport renewable gases or can the existing gas pipelines be adapted?
- What is the minimum energy self-sufficiency (if any at all) which CH needs?
Switzerland, as well as the rest of Europe, is already moving forward with the energy transition, towards a net-zero emission energy system. Intermittent renewables are planned to cover the largest portion of the future energy needs. In parallel, large sectors of energy demand, namely space heating and mobility, are increasingly being electrified. As such a pathway is progressing, in a European level, matching electricity generation with electricity demand on a continuous basis will become increasingly challenging. On the other hand, a significant gas transportation and storage infrastructure is available, which can accommodate "renewable gases", such as biomethane, hydrogen and synthetic methane. Together with thermal storage, these can provide a significant amount of valuable flexibility to the energy system. As a matter of fact, studies have already shown that a "coupled" planning and operation of the energy sectors can lead to a more economic way of meeting the energy transition targets.

The followed approach consists in modelling the energy sectors of the various European countries (more accurate modelling for Switzerland, more aggregated for the other countries) for a plurality of potential future scenarios. Each scenario is defined by
- installed capacities of electricity generation, electrolysis, methanation and biomethane production technologies,
- end energy demand of the various sectors (such as space heating, passenger mobility, electric appliances, process heating etc.),
- technologies which are used to meet the end energy demand, resulting to a final energy demand for energy carriers (such as electricity, hydrogen etc.),
- available demand flexibility.
Following, an hourly-resolution operational optimisation, covering an entire year, is performed. This allows the coupled energy system to be utilised in an optimal manner, accounting for timely conversion among energy carriers, short- and long-term energy storage and utilisation of demand flexibility. [Tool: in-house FlexECO extended to account for multiple energy sectors]
Finally, the various optimised scenarios are compared in terms of total cost (i.e. investment plus operational cost) and CO2 emissions. A progressive pathway from today’s towards a future optimal energy system will thus be identified.
The performed analysis concluded with the following findings:
1. Huge investments in electricity generation technologies are needed in order to maintain energy adequacy (measured annually) if a pathway is followed where fossil fuels are eliminated from the heating and transportation sectors.
2. Even with extremely high wind and solar penetration levels, reliably satisfying the final demand requires the presence of very high levels of installed peak power generation capacity and/or very aggressive demand-side flexibility schemes
3. Energy storage has a high value in the future energy system, at all time scales (from diurnal to seasonal). Hydrogen storage, in specific, is a great enabler for higher utilization of wind and solar.
4. It is questionable whether satisfaction of the end demand by means of hydrogen (instead of electrifying) brings value from the overall energy system perspective.
5. Switzerland just relying on the rest of Europe acting as a buffer (via electricity imports and exports) entails risks, because the moments when Switzerland will have an energy supply deficit (due to no solar availability) highly correlate with when the rest of Europe faces the same challenge.